Email Delivery Rate Explained for B2B Outbound Teams
Learn what email delivery rate measures, which metrics to track beside it, and how to diagnose drops using Gmail, Yahoo and Microsoft sender thresholds.
The most repeated outbound advice is simple. Push the email delivery rate above 95 percent, authenticate the domain, and the inbox will follow. That advice fails the moment a mailbox provider accepts the message and then hides it.
Acceptance and placement are different outcomes. A blended average can look healthy while Gmail, Microsoft, or Yahoo has already crossed a complaint or authentication line for the slice of the list that buys. Cold email has no opt-in cushion. Reputation, list quality, and how fast an opt-out is honored decide whether the next send is read.
What follows is the operator view. Formulas, provider ceilings, the records mailboxes check first, and the order to use when a number drops. Qualified replies are the business result. A green delivery percentage is only the gate in front of them.
What Email Delivery Rate Measures
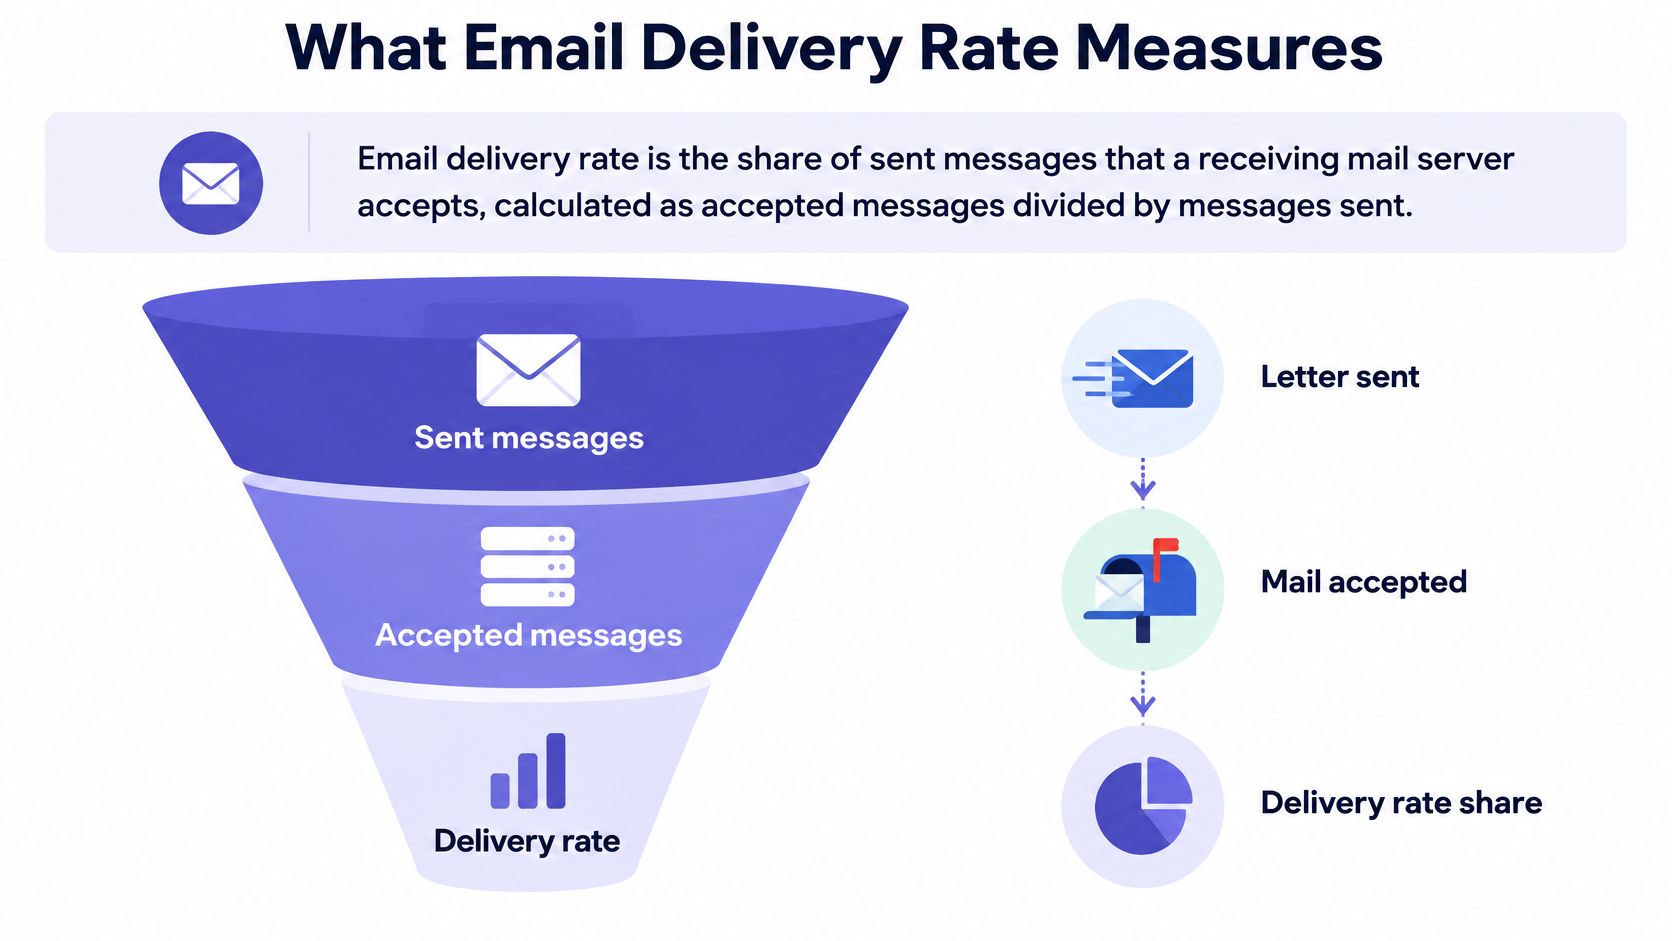
Email delivery rate is the share of sent messages that a receiving mail server accepts. Calculate it as accepted messages divided by messages sent.
A post office can scan a letter and confirm it was taken in. That scan isn't the same as the letter landing in the recipient's mailbox. Server acceptance is the scan. The folder is the mailbox.
Take a batch of 10,000 messages where receiving servers accept 9,600. The email delivery rate is 96 percent. Dashboards often stop there. If 40 percent of those accepted messages went to spam, only 5,760 reached a primary inbox. Placement is then 57.6 percent of everything sent, and that is the figure that drives replies.
Deliverability is the broader ability to reach the inbox. It is built from authentication, sender reputation, list quality, and content. A newsletter can lean on an opt-in. Cold outbound can't. The recipient never asked for the message, so mailbox providers lean harder on domain and IP reputation.
Split acceptance by provider, not only as one company-wide percentage. A 96 percent blend can still mean one provider took nearly everything while another deferred or rejected a large share of the same campaign.
A healthy delivery rate is a gate you pass, not proof that prospects saw the message.
The Metrics to Read Beside Delivery Rate
| Metric | Calculation | What it tells you | Read it with |
|---|---|---|---|
| Accepted delivery rate | Accepted messages divided by sent | Server took the message, not where it landed | Inbox placement |
| Hard bounce rate | Permanent failures divided by sent | Invalid or stale addresses, keep under 2 percent | List verification |
| Soft bounce and deferral rate | Temporary failures divided by sent | Throttling or mailbox limits, rising trend is an early warning | Provider-level reputation |
| Inbox placement rate | Seed tests in primary inbox divided by seed tests sent | Actual folder placement by provider | Accepted rate and complaints |
| Spam complaint rate | User-reported spam divided by delivered | Strongest reputation signal | Targeting and volume |
| Reply rate | Replies divided by delivered | Recipient engagement and copy relevance | Qualified lead rate |
| Qualified lead rate | Qualified opportunities divided by delivered | Business outcome of each send | Reply rate |
Most report fights start with the denominator. Accepted delivery and hard bounces use messages sent. Complaint rate, reply rate, and qualified lead rate use messages delivered, meaning the ones a server accepted. Mix those bases and two people will describe the same send as two different campaigns.
Bounces versus deferrals
Hard bounce rate flags dead or invalid addresses. Keep it under 2 percent of sent volume. Above that, enrichment never verified the file, or the list has gone stale. Suppress those addresses before the next sequence step.
Deferrals are temporary. They often mean throttling or a mailbox limit, not a dead contact. A rising deferral trend at one provider shows up before the accepted rate falls. Treat that trend as the early warning, and cut volume to that provider instead of retrying harder.
Placement and commercial outcomes
Inbox placement comes from seed accounts, reported separately for Gmail, Outlook, and Yahoo. One blended placement number hides the provider that holds the buyers.
Complaint rate is the strongest reputation signal on the sheet, and it belongs next to targeting and daily volume. Reply rate and qualified lead rate show whether the right people cared. Open rate is a poor proxy. Privacy features and mailbox filtering distort opens, so don't steer a cold program by them.
Pull every row weekly, per sending domain and per provider. A problem at one provider shouldn't disappear inside the average.
Why Benchmark Numbers Disagree
Published inbox figures disagree, and the disagreement is the useful part. Validity's 2026 benchmark reports 86.4 percent average inbox placement from seed mailboxes, while Unspam's benchmark for January to September 2026 reports 63 percent primary inbox placement and 33 percent spam placement across its own tested senders. That same Unspam data set found SPF published on 93 percent of tested domains, DKIM on 90 percent, and DMARC on 48 percent, yet a third of the tested mail still reached the spam folder.
| Source | Reported figure | What it measures | Why it differs |
|---|---|---|---|
| Validity 2026 benchmark | 86.4 percent average inbox placement | Seed mailbox placement across tested senders | Controlled seed test with its own provider mix and definition of inbox |
| Unspam benchmark, January to September 2026 | 63 percent primary inbox, 33 percent spam | Placement of tested emails | Different sample, providers and test design |
| Unspam authentication adoption | SPF and DKIM on most tested domains, DMARC on about half | Records published on tested domains | Measures published records, not where mail landed |
| Your own seed and campaign data | Placement and complaint rate by provider | Your real audience and their filters | The reference that should drive decisions |
The spread between those rows is the point.
Each figure is accurate inside its own test design, and each describes a different population: who sent the mail, which providers received it, and what the study counted as the inbox. The Unspam numbers carry a second lesson worth keeping. Near-universal SPF and DKIM coverage coexisted with a heavy spam share, which means a benchmark average blends fully authenticated senders with domains missing records. Copying that average onto a properly configured domain imports someone else's problems into your forecast.
What to check before borrowing a figure
Provider mix. A seed panel spread evenly across Gmail, Outlook, and Yahoo produces a different average than a list where buyers sit mostly in one system. Check which providers the study weighted before you apply its number to your list.
Domain condition. A warmed domain and a brand-new domain aren't the same sender, even with identical copy, and a published benchmark mixes both.
Folder rules. Counting a promotions tab as inbox moves the percentage without moving a single message.
Read any benchmark as a sanity check on the shape of the problem. Then make the volume call on your own seeds and campaign logs, split by provider, because those are the only figures that describe the filters your buyers use.
Mailbox Provider Thresholds That Set Your Ceiling
| Mailbox rule | Threshold | Consequence if missed |
|---|---|---|
| Google user-reported spam rate | Below 0.1 percent, never 0.3 percent or higher | Stronger negative effects on inbox delivery, and mitigation can become unavailable |
| Yahoo user-reported spam rate | Below Yahoo's complaint ceiling | Spam-rate violations count as non-compliance and push mail toward spam |
| Microsoft high-volume consumer senders | More than 5,000 messages per day with SPF, DKIM and aligned DMARC at p=none or stricter | Authentication failures at Outlook.com, Hotmail.com and Live.com |
These limits apply per recipient provider, and each one judges your mail independently. A campaign can post a healthy blended average while the single provider holding the deals sits past its own line. Read each provider's number on its own before judging the batch.
A 10,000-message batch at Google
Google tells bulk senders to keep the user-reported spam rate below 0.1 percent and prevent it from reaching 0.3 percent or higher, and beginning in June 2024 Google's sender guidance made bulk senders above 0.3 percent ineligible for certain mitigation. The rate is calculated daily. On 10,000 messages, 0.1 percent is 10 complaints and 0.3 percent is 30. Those are different operating levels. A sustained rate at the upper line can hurt inbox delivery even when authentication passes, because recipients marking the mail as spam overrides a clean SPF, DKIM and DMARC result.
Microsoft's high-volume line
Microsoft's announcement applies once a sender exceeds 5,000 messages per day to Outlook.com, Hotmail.com, Live.com, and related consumer mailboxes. SPF must pass and identify the sending infrastructure. DKIM must pass and cryptographically sign the message. DMARC must be published at least at p=none and align with SPF or DKIM, preferably both.
Splitting volume across several dedicated inboxes changes nothing here. The provider evaluates the domain and the authentication relationship, not the count from one mailbox. A low-volume cold campaign can still trip the line if several inboxes send under the same domain, so the three-record architecture stays the baseline regardless of scale. Retest after every DNS change. A domain that omits its sending provider from SPF, fails DKIM, or lacks aligned DMARC can fail while a single inbox still looks fine.
Yahoo runs a complaint ceiling of its own. The unsubscribe mechanics that sit beside it are a suppression job, not a DNS task.
Pause a sequence when complaints approach 0.1 percent. Don't wait for 0.3 percent.
Authentication Records Mailboxes Check First
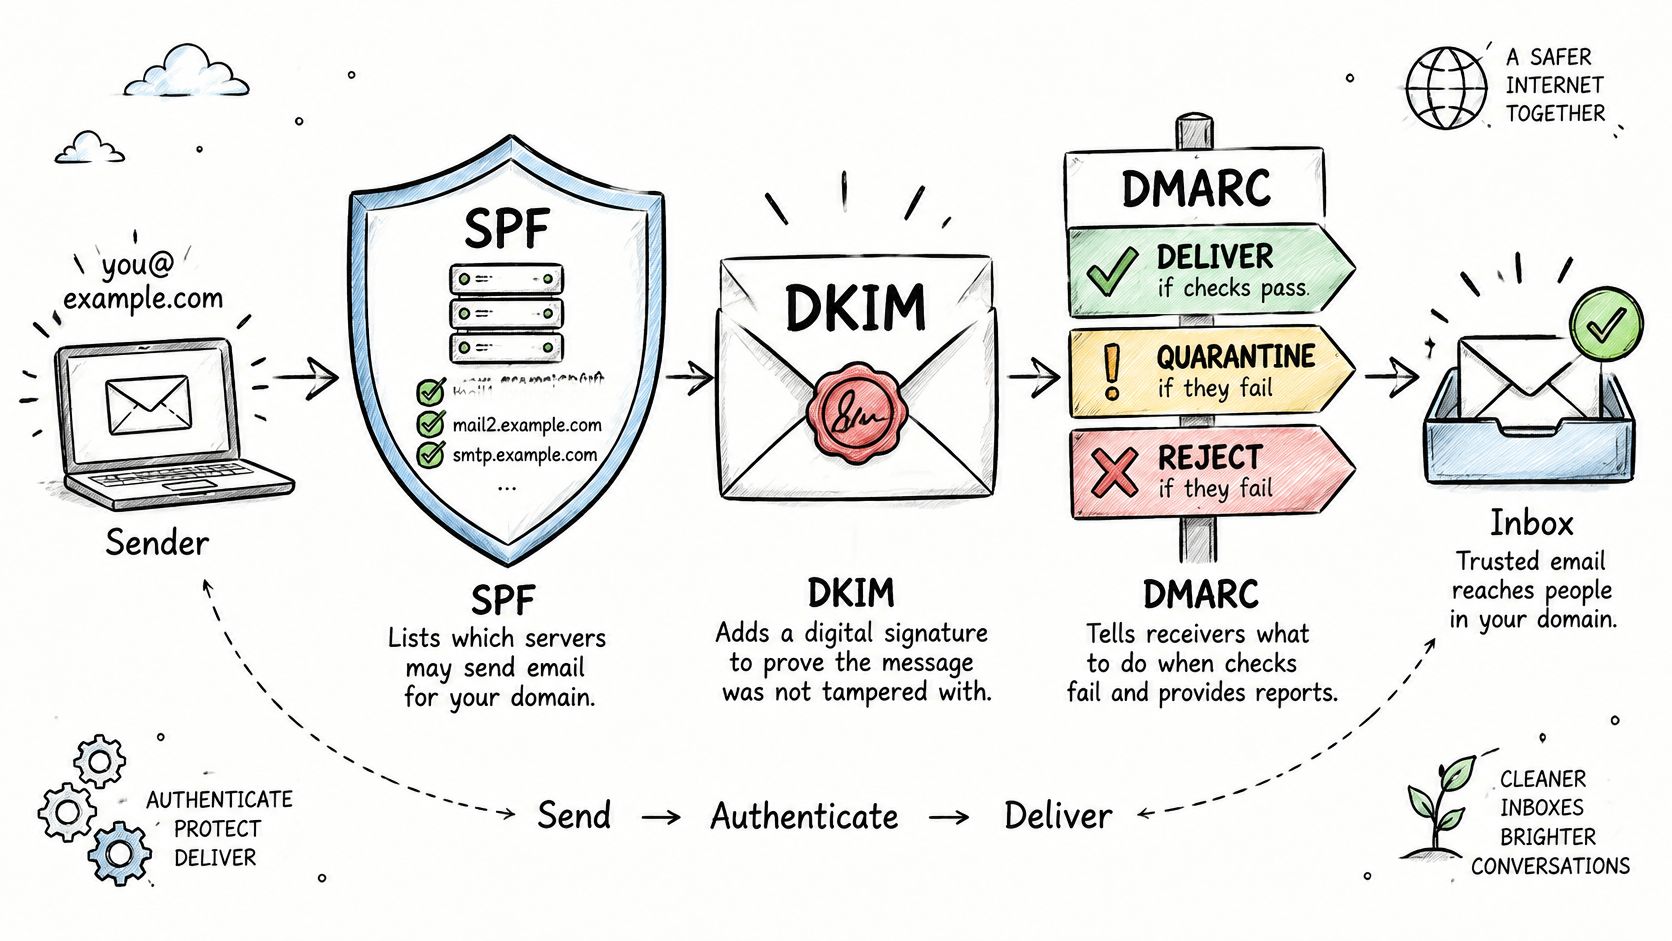
Three records, three jobs. SPF lists which servers may send for the domain. DKIM signs the message so tampering is detectable. DMARC tells receivers what to do when checks fail, and it sends reports back to you.
Alignment is the piece teams skip. The visible From domain has to match the organizational domain authenticated by SPF or DKIM. A passing signature on some other domain doesn't count.
Google's email sender guidelines require SPF or DKIM for senders, and both SPF and DKIM plus a DMARC policy for bulk senders, with the From domain aligned to either organizational domain. Miss that and the result can be a temporary or permanent failure, throttling, or spam-folder placement. The same three protocols are how major mailbox systems separate authorized mail from spoofed traffic. A pass establishes identity. It doesn't guarantee placement. Complaints and engagement still decide the folder.
Setup on every sending domain
- Publish an SPF record that lists only the providers you use.
- Turn on DKIM signing in the sending platform and publish the key.
- Publish DMARC at p=none with a reporting address, so failures show up before the policy gets stricter.
- Send a test to a Gmail account and read the headers for pass results.
- Confirm alignment again after a CRM, a forward, or any relay touches the message.
The quiet break is adding a CRM or relay and forgetting SPF. One domain starts failing while the others still pass. Watch pass rates, alignment, deferrals, hard bounces, and complaints by domain and by provider, and keep "accepted by the server" separate from inbox placement.
Run the same header test on an Outlook.com account before real volume leaves the domain. High-volume traffic into Outlook.com, Hotmail.com, and Live.com is judged on that relationship, not on how tidy one inbox looks.
Warm New Sending Domains Before Cold Volume
Warming starts only after the new domain passes authentication. Volume on a domain that fails headers trains providers to distrust it.
- Publish SPF, DKIM, and DMARC with reporting, then confirm pass results on a Gmail test and an Outlook.com test.
- Start with a low daily cap per dedicated inbox, sent to people likely to recognize the sender, such as existing customers or contacts who replied before.
- Hold that cap through the first week so providers see a steady pattern, not a spike.
- Raise the cap in small steps only when seeds show primary-inbox placement at each major provider and complaints stay inside your pause point.
- Freeze the ramp if deferrals rise at any provider.
Say three inboxes send 15 messages each. That's 45 sends in a day. One complaint that day is 2.2 percent of volume. One afternoon isn't a verdict, but it is a reason to stop the ramp. Judge complaints over a rolling window, and keep the cap flat until that window is clean.
A warmed domain won't rescue people who never matched the offer. Copy, list cuts, and follow-up timing still decide whether the new capacity produces replies. The notes on cold email tips cover how message and audience choices interact with this ramp.
Suppression Rules That Protect Your Sending Reputation
An opt-out has to reach every sending inbox inside the window the mailbox provider expects. Yahoo's sender best practices say to keep the spam rate below 0.3 percent, use a functioning List-Unsubscribe header that supports one-click removal, show a visible unsubscribe link in the body, and honor unsubscribes within two days. Yahoo points to the RFC 8058 method for that one-click action. A footer link with no working header doesn't cover the recommendation.
A prospect opts out after email one. Suppression has to block email two and email three in every inbox and in the CRM. If the sequence tool and the CRM disagree, the second note still goes out, and one opt-out becomes a complaint.
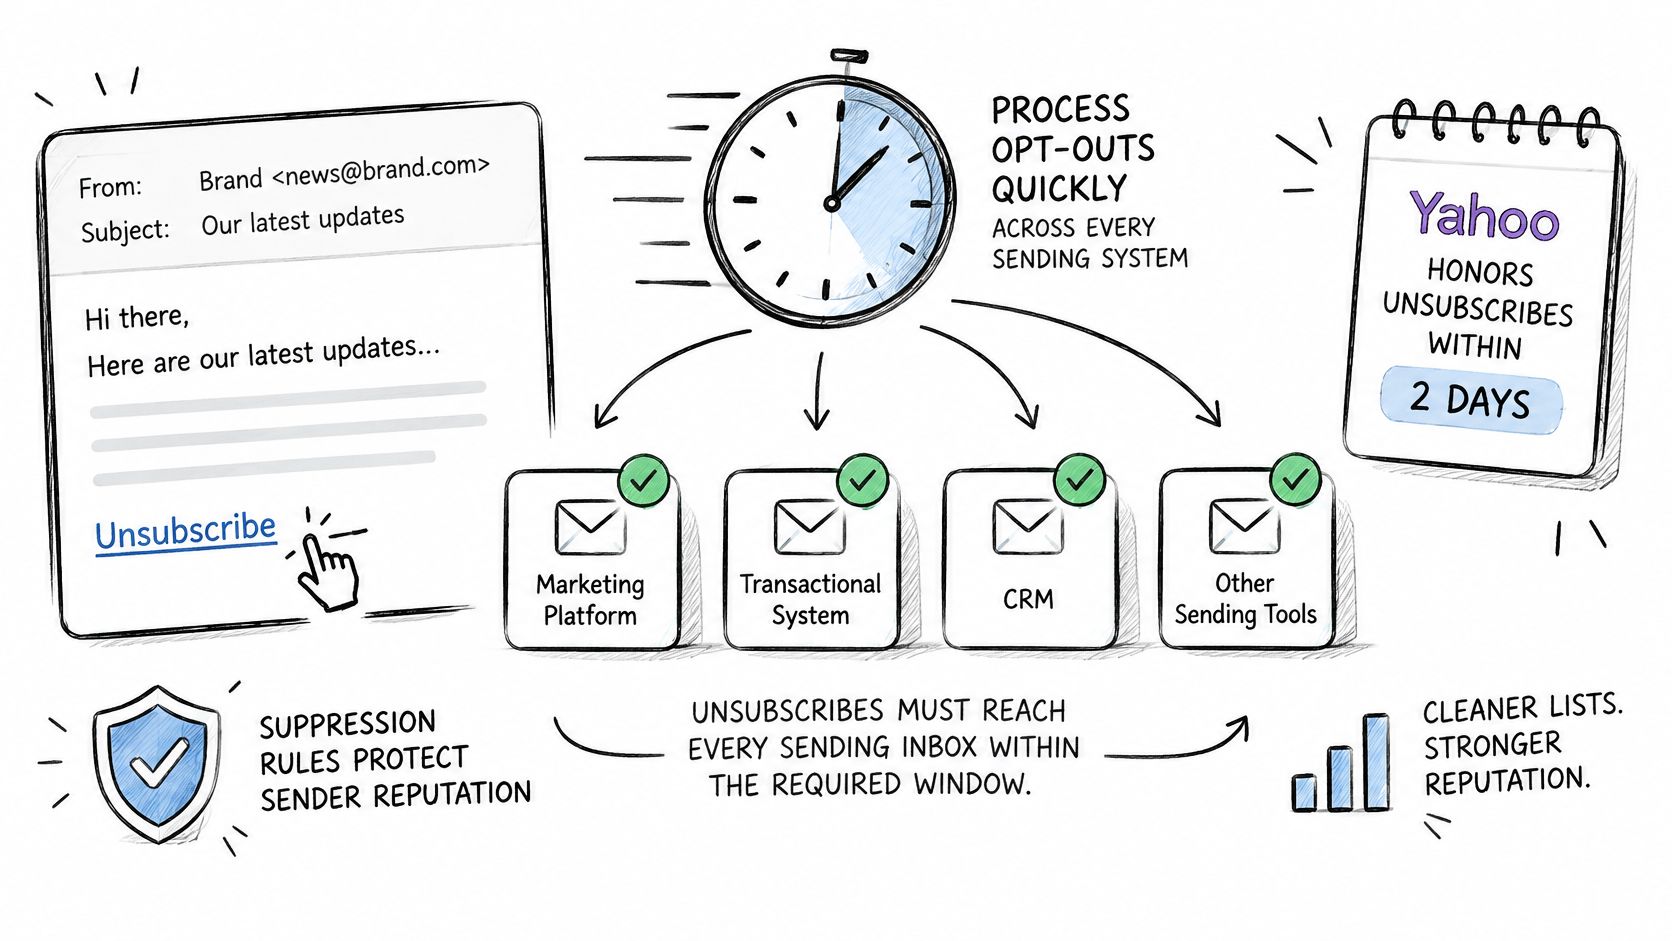
- One list. Keep a central suppression list shared by every sending inbox.
- Reply language. Automatically suppress replies that say stop, remove, or not interested.
- Pre-send check. Consult that list before each scheduled send.
- Hard bounces. Remove them immediately and don't send again.
- Extra blocks. Put role addresses and recent complainers on a do-not-contact list.
Spreadsheet copies fail this. One file misses the other inboxes, and the sequence keeps firing. Two days is too short for manual cleanup on an active program.
A complaint is a signal to shrink the audience and tighten targeting, never a reason to add another inbox. That shrink starts in the file itself. Lead generation list work that drops invalid and unmatched records is what keeps later steps off bad addresses.
How to Diagnose a Drop in Delivery Rate
A high accepted rate can hide a threshold breach at one mailbox provider. Gmail placement can slide while other providers stay stable, leaving the blended delivery number looking healthy. Match the symptom before changing volume; the first fix is usually smaller than teams expect.
| Symptom | Likely cause | First fix |
|---|---|---|
| Bounces rising, accepted rate falling | Stale or invalid addresses in the list | Verify addresses and suppress hard bounces before the next send |
| Deferrals rising at one provider | Throttling from volume or reputation strain | Lower volume to that provider and watch deferrals daily |
| Accepted rate steady, placement falling | Spam filtering from complaints or weak authentication | Check complaint rate and DMARC alignment for that provider |
| Complaints crossing your pause point | Poor targeting or an irrelevant offer | Pause the sequence and shrink the audience to matched prospects |
| Authentication fails after adding a sender | New relay or CRM missing from SPF | Add it to SPF and retest headers before sending again |
| Delivery steady, replies falling | Copy or offer mismatch | Test subject lines and the offer, not the infrastructure |
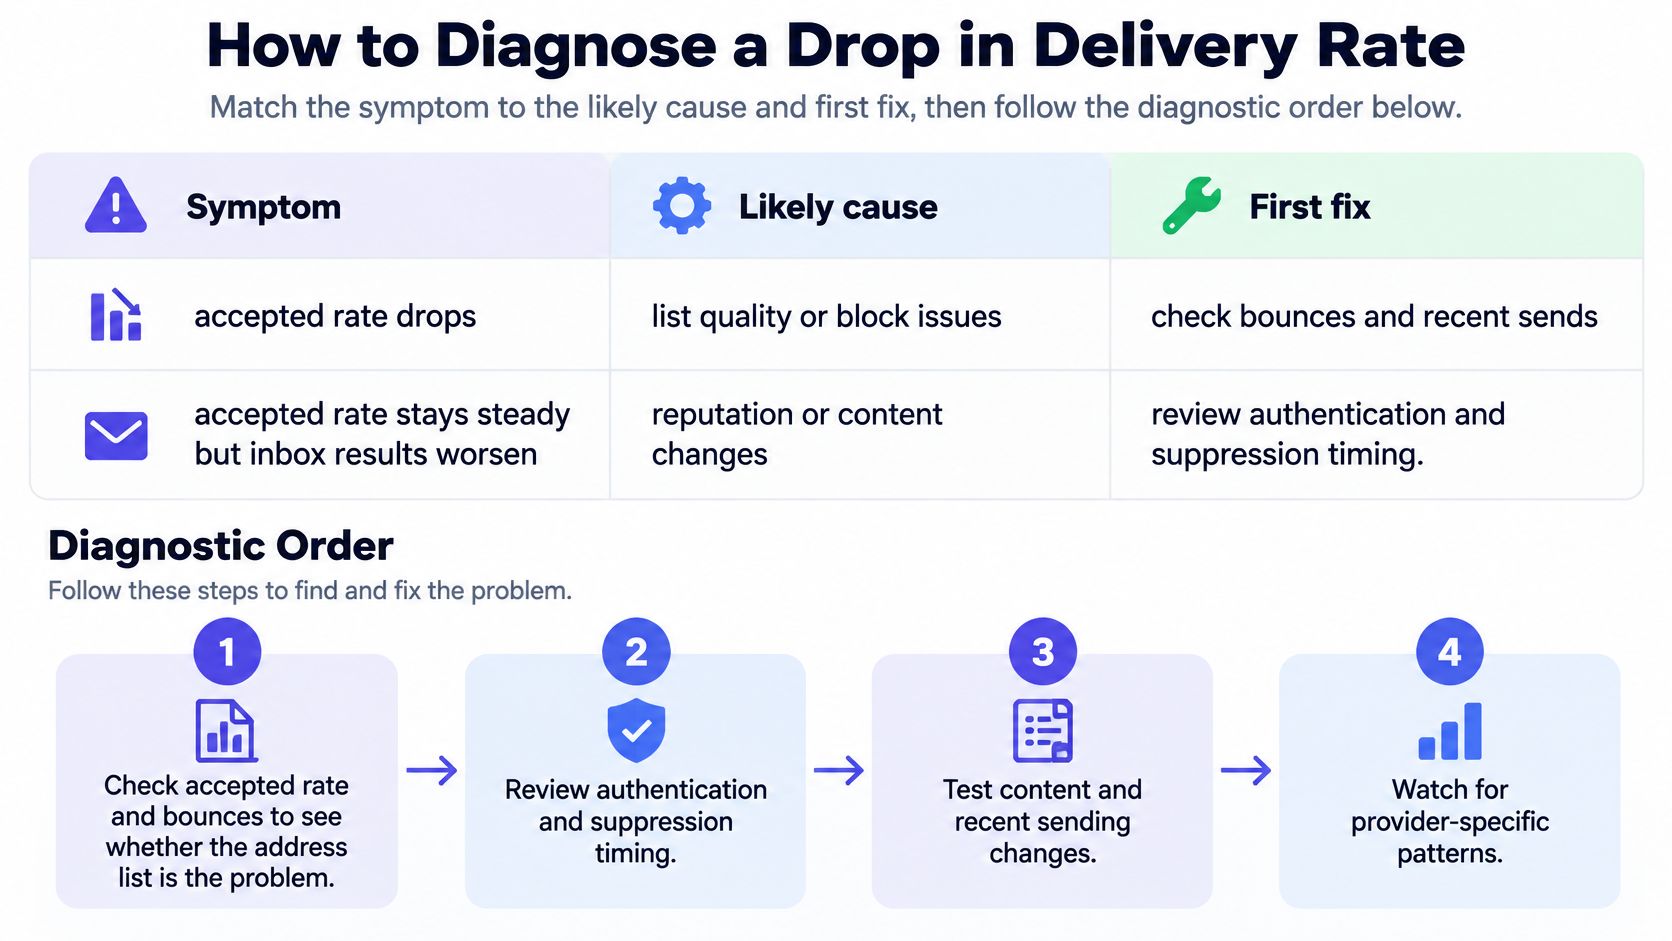
When acceptance holds and placement doesn't
Take a domain with a 97 percent accepted rate while Gmail placement falls from 80 percent to 55 percent. Run the provider-level checks in order:
- Check Gmail bounces and deferrals. Stable results mean address quality and throttling are not the immediate causes. Rising deferrals point to reputation strain and call for lower Gmail-bound volume.
- Check Gmail complaints. Crossing your pause point makes targeting or offer relevance the first fix. Staying below it moves the check to authentication.
- Check DMARC alignment and headers from the affected inbox. A failure after a sender or CRM change points to a missing relay in SPF. A pass leaves provider reputation or complaints as the likely strain.
- Compare Gmail placement against the other major providers. A Gmail-only decline points to that provider. A decline across providers points back to complaints or targeting across the program.
- Check reply rate after placement. Steady placement with falling replies indicates a copy or offer problem. Falling placement makes the infrastructure and reputation checks come first.
That combination of stable acceptance, flat deferrals and clean authentication would make Gmail reputation the likely source. Check which segment or sequence is dragging placement before treating it as a list problem.
When delivery stays steady and replies fall, leave DNS alone. Test the subject line and the offer, because a campaign-side drop needs a different fix from an infrastructure drop. The walkthrough on email delivery issues sorts those causes after the provider checks.
Same day means pausing the affected sequence, suppressing hard bounces and stopping any inbox deferring hard at one provider. Weeks means lower volume, cleaner segments and copy aimed at people who match the offer. Don't swap those timelines. Add volume and extra inboxes only after placement recovers.
Set Your Delivery Baseline Before You Scale Volume
Pull 30 days for each sending domain and each major provider. Accepted rate, hard bounces, deferrals, seed placement, complaint rate, and reply rate each get their own row. Scaling without that split is how a small reputation problem becomes a domain-level one. The usual failure sequence is volume raised before the 30-day split gets reviewed, so the provider where placement was already weak absorbs the most new sends.
One go or no-go rule
Go when complaints stay under your pause point and placement meets the target at every major provider. Raise volume in steps, holding each step long enough for placement and complaints to settle before the next one. Don't double it in one jump.
No-go when either test fails. Use the symptom map before any extra volume.
A domain can post a 97 percent accepted rate with complaints at 0.05 percent, Gmail placement at 85 percent, and Yahoo placement at 40 percent. Four of those numbers pass. The fifth is the reason the Yahoo-heavy segment stays frozen until Yahoo placement recovers, because one provider under the threshold is still a breach no matter how the rest read. Save that baseline per domain and per provider so later decisions use the same numbers, and re-pull the 30-day split after every volume step rather than after something breaks.
IronPeak Marketing runs managed B2B cold email on dedicated infrastructure, with authenticated domains and daily inbox handling so delivery rate and placement stay visible while campaigns run. If you want that baseline built and watched instead of rebuilt after a domain is burned, visit IronPeak Marketing. The setup, the follow-ups, and the inbox work stay on qualified conversations, not on a single green percentage.